 Fundamentals Hub

You have a list of tickers: AAPL, MSFT, GOOGL. You want five years of revenue, operating income, and free cash flow in a pandas DataFrame. Pulling financial data in Python comes down to two decisions: where the data comes from, and what you do with it once it arrives.
Here is the end state, and this post works backwards from it:
import requests, pandas as pd, time

API_KEY = "your_api_key"
BASE_URL = "https://fundamentalshub.com/api/v1"

# Look up CIKs via GET /api/v1/search?q=TICKER
tickers_to_cik = {"AAPL": 320193, "MSFT": 789019, "GOOGL": 1652044}
rows = []

for ticker, cik in tickers_to_cik.items():
    resp = requests.get(
        f"{BASE_URL}/company/{cik}/fundamentals",
        params={"period_type": "FY"},
        headers={"Authorization": f"Bearer {API_KEY}"}
    )
    for period in resp.json().get("data", []):
        period["ticker"] = ticker
        rows.append(period)
    time.sleep(1)  # Respect rate limits

df = pd.DataFrame(rows)[["ticker", "period_end", "revenue", "operating_income", "free_cash_flow"]]
This is a Python implementation post. For background on why XBRL parsing is complex, the XBRL data guide goes deep on tag inconsistency. For the financial concepts, the free cash flow explainer and EBITDA guide address those separately.
What "Financial Data in Python" Actually Means
- Fundamental Financial Data
- Income statements, balance sheets, and cash flow statements from SEC filings. Distinct from price data, market data, or news/sentiment.
- SEC EDGAR XBRL API
- Free public API at data.sec.gov providing structured financial facts for all US public companies. Requires User-Agent header, rate-limited to 10 req/sec.
- Company Facts Endpoint
- The primary SEC EDGAR endpoint returning every XBRL-tagged financial fact for a single company across all filings.
- Period Types
- FY (annual from 10-K), Q (standalone quarter), TTM (trailing twelve months). Each serves different analysis needs.
Before writing code, clarify what you're fetching. This post addresses fundamental financial data, income statements, balance sheets, and cash flow statements. That's distinct from:
- Price data: Current or historical stock prices (Yahoo Finance, Polygon.io)
- Market data: Options chains, short interest, order flow
- News/sentiment: Earnings transcripts, 8-K announcements
For fundamentals, revenue, net income, total assets, free cash flow, the authoritative source is SEC EDGAR. Every US public company files quarterly (10-Q) and annual (10-K) reports with the SEC, and the SEC exposes that data as structured XBRL for free. The engineering question is whether you parse that raw format yourself or use an API that has already done it.
Option 1: Pulling Directly from SEC EDGAR in Python
The SEC XBRL API requires no API key and covers all US public companies. The minimum viable request:
import requests

headers = {
    "User-Agent": "YourApp your@email.com",  # Required - missing this returns 403
    "Accept-Encoding": "gzip, deflate"
}

# CIK must be zero-padded to exactly 10 digits
cik_padded = "0000320193"  # Apple

response = requests.get(
    f"https://data.sec.gov/api/xbrl/companyfacts/CIK{cik_padded}.json",
    headers=headers
)
facts = response.json()
The User-Agent header is mandatory, not a suggestion. The SEC's fair access policy mandates identifying your application and a contact email. The default python-requests/2.x string gets blocked with a 403 and no explanation.
What comes back is a JSON file containing thousands of XBRL tags. Finding revenue in it requires knowing that Apple used SalesRevenueNet through FY2018 and then switched to RevenueFromContractWithCustomerExcludingAssessedTax when it adopted ASC 606, and that both represent the same economic concept but live under different keys. For each Q2 or Q3 flow fact, compare its start and end dates: use a quarter-duration fact as reported, but subtract the prior cumulative value when the fact runs from the fiscal-year start. Balance sheet items are point-in-time stocks and must not be subtracted. Q4 has no separate 10-Q; derive additive Q4 flows from the 10-K FY value minus the normalized Q1 through Q3 quarters.
Building production-grade XBRL parsing is a multi-week project. It's the right path if you need every field from every filing. For most Python projects that need clean fundamentals, a normalized API gets you there faster.

Option 2: A Financial Data API (Same Source, Less Work)
A financial data API sits on top of SEC EDGAR and resolves tag mapping, full-year duration filtering, cross-concept revenue reconciliation, cumulative-flow subtraction, Q4 derivation, and period selection. Revenue selection keeps semantic priority except for two scope proofs: (1) an exact-zero priority FY with another positive full-year revenue candidate (negative revenue is not zero); or (2) only when the nonnegative priority candidate does not reconcile, a reconciling alternative whose Q1-Q3 subtotal exceeds the priority FY. Otherwise keep priority. The same Apple data via Fundamentals Hub:
import requests

API_KEY = "your_api_key"  # Free tier: 100 requests/30 days, 1 req/min
BASE_URL = "https://fundamentalshub.com/api/v1"

response = requests.get(
    f"{BASE_URL}/company/320193/fundamentals",
    params={"period_type": "FY"},
    headers={"Authorization": f"Bearer {API_KEY}"}
)
data = response.json()
latest = data["data"][0]  # API returns newest period first

print(f"Revenue: ${latest['revenue'] / 1e9:.1f}B")
print(f"Operating income: ${latest['operating_income'] / 1e9:.1f}B")
print(f"Free cash flow: ${latest['free_cash_flow'] / 1e9:.1f}B")
# Revenue: $416.2B
# Operating income: $133.1B
# Free cash flow: $98.8B
The canonical fields, revenue, operating_income, net_income, cfo, free_cash_flow, are consistent across every company regardless of which XBRL tags the filer uses internally.
(Fundamentals Hub also returns provenance fields showing which XBRL tags populated each value, useful when you need to trace a figure back to the raw filing.)
Your First Query: Annual Fundamentals
Annual data from 10-K filings is the simplest starting point. No YTD subtraction, no quarter alignment, one record per fiscal year.
import requests

API_KEY = "your_api_key"
BASE_URL = "https://fundamentalshub.com/api/v1"

def get_fundamentals(cik: int, period_type: str = "FY") -> list[dict]:
    """Fetch financial fundamentals for a company by CIK."""
    response = requests.get(
        f"{BASE_URL}/company/{cik}/fundamentals",
        params={"period_type": period_type},
        headers={"Authorization": f"Bearer {API_KEY}"}
    )
    response.raise_for_status()
    return response.json().get("data", [])


# Apple CIK: 320193 (find via GET /api/v1/search?q=AAPL)
apple_fy = get_fundamentals(320193, "FY")

for period in reversed(apple_fy[:5]):  # Latest 5 fiscal years, oldest first
    print(
        f"{period['period_end'][:4]}: "
        f"Revenue ${period['revenue'] / 1e9:.1f}B  "
        f"Net income ${period['net_income'] / 1e9:.1f}B"
    )
2021: Revenue $365.8B Net income $94.7B
2022: Revenue $394.3B Net income $99.8B
2023: Revenue $383.3B Net income $97.0B
2024: Revenue $391.0B Net income $93.7B
2025: Revenue $416.2B Net income $112.0BPeriod type options:
FY- Annual data from 10-K filings. One record per fiscal year. Use for trend analysis and year-over-year comparisons.Q- Standalone quarterly data. The API checks each Q2/Q3 flow fact's duration, subtracts only cumulative facts, and derives Q4 from the annual 10-K.TTM- Trailing twelve months. Flow fields sum four consecutive standalone quarters, while stock fields use the latest quarter-end value.
Pulling Multiple Companies
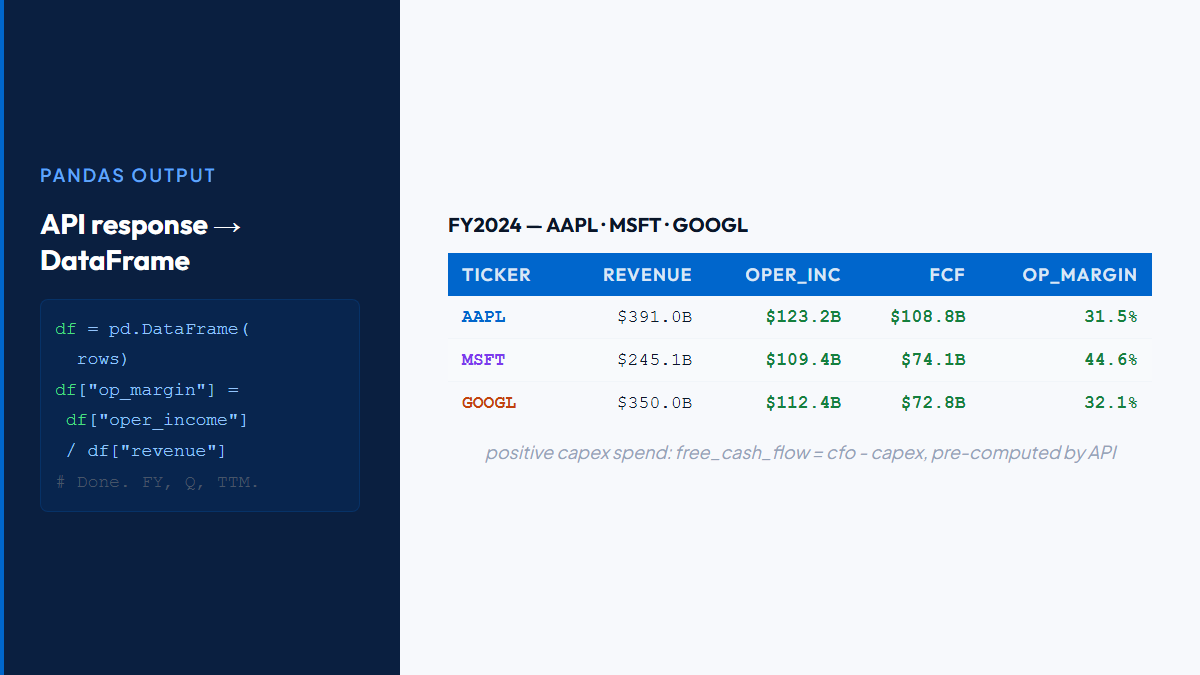
import requests, time, pandas as pd

API_KEY = "your_api_key"
BASE_URL = "https://fundamentalshub.com/api/v1"

# Use GET /api/v1/search to find CIKs for any ticker
COMPANIES = {
    "AAPL": 320193,
    "MSFT": 789019,
    "GOOGL": 1652044,
}

def get_fundamentals(cik: int, period_type: str = "FY") -> list[dict]:
    response = requests.get(
        f"{BASE_URL}/company/{cik}/fundamentals",
        params={"period_type": period_type},
        headers={"Authorization": f"Bearer {API_KEY}"}
    )
    response.raise_for_status()
    return response.json().get("data", [])

rows = []
for ticker, cik in COMPANIES.items():
    periods = get_fundamentals(cik, "FY")
    for period in periods:
        period["ticker"] = ticker
        rows.append(period)
    time.sleep(3)  # paid tier (20 req/min, 3s between requests); use time.sleep(61) on free tier (1 req/min)

df = pd.DataFrame(rows)
print(f"Fetched {len(df)} period records for {len(COMPANIES)} companies")
Working with the Results: Pandas Integration
Once the data is in a list of dicts, one line converts it to a DataFrame.
import pandas as pd

df = pd.DataFrame(rows)
df["period_end"] = pd.to_datetime(df["period_end"])
df = df.sort_values(["ticker", "period_end"]).reset_index(drop=True)

# Select fields for analysis
cols = ["ticker", "period_end", "revenue", "operating_income",
        "net_income", "free_cash_flow"]
df = df[cols].copy()

# Derived metrics
df["operating_margin"] = df["operating_income"] / df["revenue"]
df["fcf_margin"] = df["free_cash_flow"] / df["revenue"]

# Filter to last 5 fiscal years
cutoff = pd.Timestamp.now() - pd.DateOffset(years=5)
recent = df[df["period_end"] >= cutoff]

# Revenue pivot by company (in billions)
revenue_pivot = (
    recent.pivot(index="period_end", columns="ticker", values="revenue") / 1e9
)
print(revenue_pivot.round(1))
A few field-level notes for pandas work:
- Fundamentals Hub stores
capexas a positive cash expenditure.free_cash_flowis pre-computed ascfo - capex, so use it directly. - Balance sheet fields (
total_assets,total_equity,total_debt) are point-in-time as of the period end date. Don't average them across periods without knowing what you're averaging. - Some companies don't tag every field in XBRL, so
free_cash_floworcapexmay beNonefor certain periods. Usedf.dropna(subset=["free_cash_flow"])before computing FCF-based metrics.
If you're building financial ratios from these fields, the financial statements guide explains how the three statements connect.
Fundamentals Hub delivers standardized financial data for 8,000+ companies via REST API, ready for pandas. You can try the free tier here.