 Fundamentals Hub
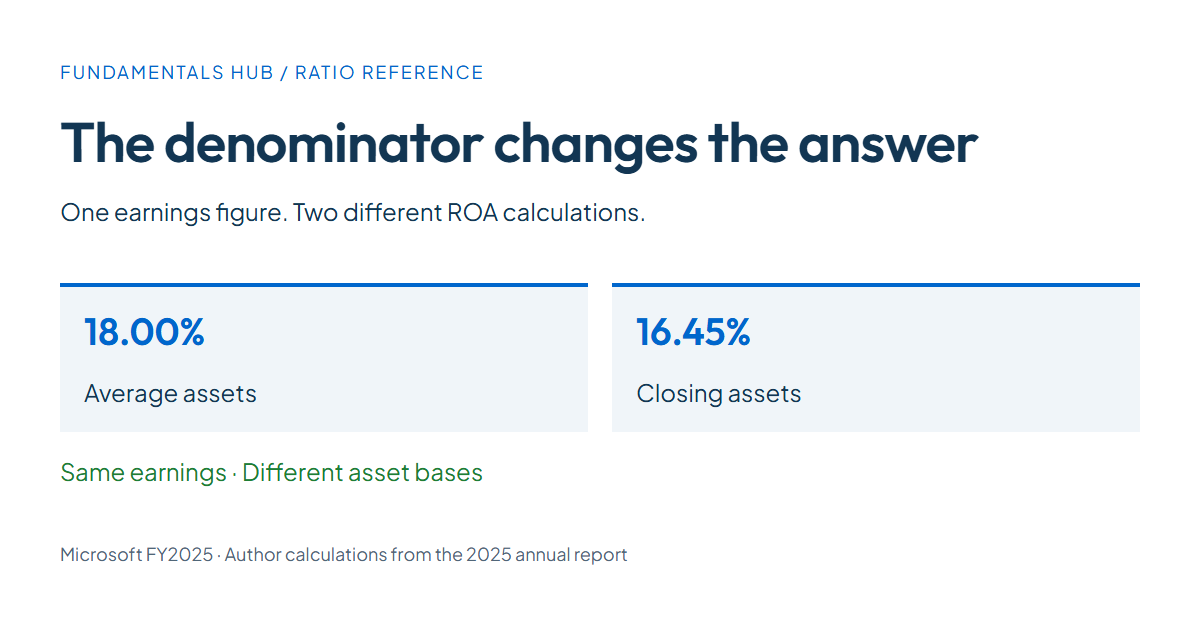
Replace closing assets with average assets in a return calculation and the percentage changes, even though earnings stay identical. Both outputs can look plausible in a spreadsheet. Without the denominator definition, a reader cannot tell why they differ.
Financial ratio analysis starts with that precision: specify the inputs before interpreting the result. This reference covers core statement-based ratios for nonfinancial companies, their time bases, and the cases where a calculation should stop. It includes a historical Microsoft example, rather than a ranking or investment recommendation.
For choosing which measures answer a business question, use the financial statement analysis guide. For a broader research workflow, follow the stock fundamentals checklist. Here, the focus is making each formula reproducible.
Financial Ratio Analysis: Formula Reference
- Financial ratio analysis
- Comparing specified financial statement amounts using consistent definitions, units, and reporting periods.
- average assets
- An asset balance averaged across the earnings interval; this guide uses the opening and closing balances.
- Current ratio
- Current assets divided by current liabilities at the same reporting date.
- CFO
- Cash flow from operating activities for the specified reporting interval.
Record the numerator, denominator, and output unit for each ratio. The core formulas below follow CFA Institute's financial ratio list: liquidity, margins, returns, and turnover are on page 1; debt measures are on page 2. Definitions can differ, so save the chosen convention alongside the result.
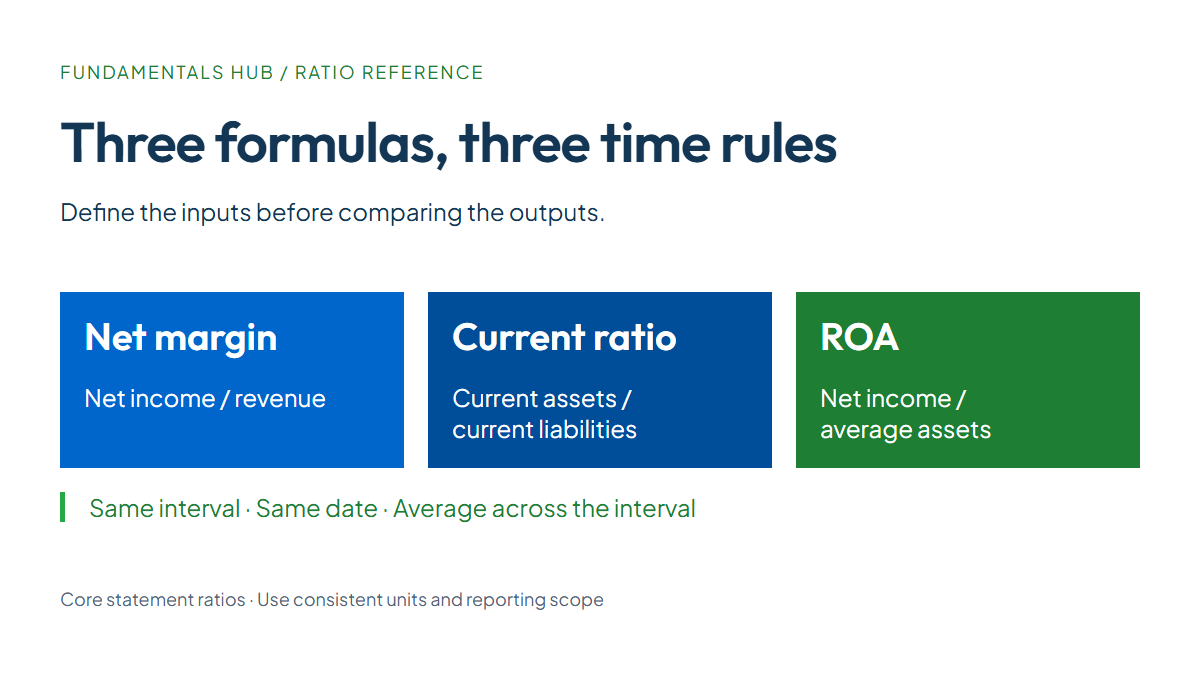
In this table, “average” means opening plus closing balance, divided by two. Multiply margin and return fractions by 100 to display percentages. An output of 0.25 is 25%, while a current ratio of 1.25 is displayed as 1.25x.
| Measure | Formula | Time basis |
|---|---|---|
| Gross margin | Gross profit / revenue | Same interval |
| Operating margin | Operating income / revenue | Same interval |
| Net margin | Net income / revenue | Same interval |
| Return on assets (ROA) | Net income / average assets | Interval plus opening/closing balances |
| Return on equity (ROE) | Net income / average equity | Same interval; match ownership scope |
| Current ratio | Current assets / current liabilities | Same date |
| Quick ratio | (Cash + short-term marketable investments + receivables) / current liabilities | Same date |
| Debt to equity | Interest-bearing debt / equity | Same date |
| Debt to assets | Interest-bearing debt / assets | Same date |
| Asset turnover | Revenue / average assets | Same reporting interval |
| Inventory turnover | Cost of goods sold / average inventory | Same reporting interval |
| CFO conversion | Operating cash flow / net income | Same interval |
| Free cash flow margin | (Operating cash flow - cash capital expenditure) / revenue | Same interval |
For the last two rows, CFO means cash flow from operating activities, and cash capital expenditure is a positive outflow amount. This guide defines free cash flow as CFO minus cash capex. The free cash flow explainer shows how to calculate and interpret that measure. It is not the same as free cash flow to the firm: CFA Institute lists FCFF separately, including an after-tax interest adjustment when interest has reduced CFO.
Profitability and Returns: Match Flows With Average Balances
A margin divides one flow by another. Annual operating income belongs with annual revenue, and a three-month profit figure belongs with three-month sales. A return measure combines earnings over an interval with resources recorded at individual dates, so its denominator needs a different treatment.
For annual ROA, average the assets at the previous fiscal year-end and the current fiscal year-end. For a trailing-twelve-month calculation, use balances spanning that same twelve-month window. Averaging the latest two quarter-end balances does not represent a full year's opening and closing position.
Two observations are an approximation. A large acquisition just before year-end can inflate the closing asset balance while contributing little earnings during the year. Quarterly or monthly observations can improve the estimate if available; disclose the averaging method so another analyst can reproduce it.
ROE also needs ownership consistency. Match income attributable to the relevant shareholders with their equity; a common-shareholder return needs earnings after preferred dividends and average common equity. A total consolidated income figure paired with parent-only equity can silently mix ownership scopes. Share repurchases can shrink the denominator and increase ROE without improving operating profitability.
Liquidity and Leverage: Define Debt Precisely
The current ratio compares balances at one date. It does not establish that receivables will be collected before obligations fall due. For the quick ratio, build the numerator from qualifying liquid assets: subtracting inventory alone from current assets can leave prepayments and other items that cannot settle a bill.
Debt in this reference means interest-bearing borrowing, not every liability. Trade payables, deferred revenue, and tax obligations belong in total liabilities but are not automatically included in that debt definition. Label liabilities-to-equity separately if that broader measure is what your dataset calculates.
Check current maturities before adding short-term and long-term borrowing. A note headed “total long-term debt” may already include the portion due within a year; adding that portion again overstates debt. State whether lease liabilities are included, and keep the treatment consistent across peers. The same caution applies to cash when calculating net debt: restricted cash is not interchangeable with freely available liquidity.
Avoid universal pass/fail thresholds. The SEC's financial statement guide explains that desirable ratios vary by industry. Banks and insurers need a sector-specific framework; an industrial-company liquidity table is not a substitute for regulatory capital or insurance reserve analysis.
Efficiency and Cash Conversion: Keep Periods Consistent
Asset turnover measures sales relative to the asset base supporting them. Inventory turnover uses cost of goods sold, because inventory is carried at cost rather than selling price. Swapping revenue into that numerator changes the measure and makes gross-margin differences contaminate the comparison.
For days inventory outstanding, divide the number of days in the reporting interval by inventory turnover calculated over that interval. A quarterly turnover figure paired with 365 days produces an annual-looking answer from three months of activity. Use the actual interval length, especially for companies with 52- or 53-week fiscal calendars.
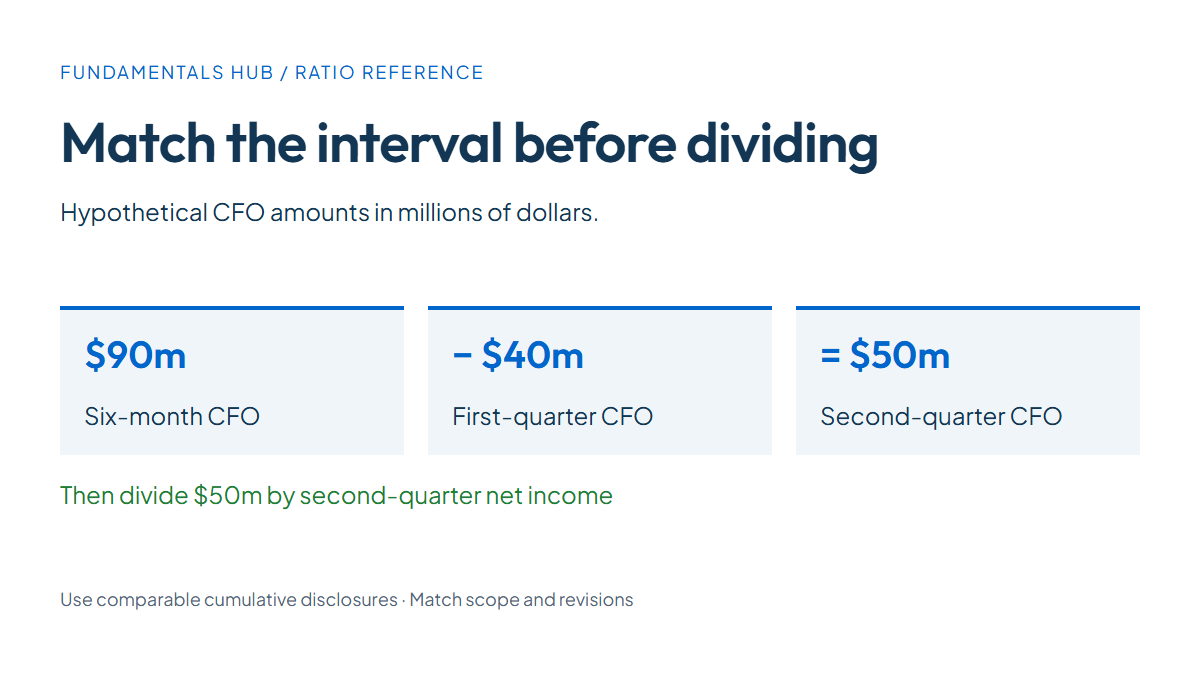
Cash conversion introduces another trap. A U.S. 10-Q cash flow statement normally reports cumulative fiscal-year activity, while its income statement can present both quarterly and year-to-date columns. The interim cash flow period is specified in Regulation S-X, Rule 10-01(c)(3), subject to a narrow seasonal-business exception in subsection (c)(4). For a quarter-only CFO numerator, subtract the prior cumulative amount from the current one, using comparable reporting scopes and restated figures where applicable.
Do not infer duration from an XBRL fiscal-quarter label alone. Inspect the fact's start and end dates. Six-month CFO divided by three-month net income can create an apparent cash-conversion improvement that is entirely a period mismatch. The XBRL data guide explains the broader tagging problem.
(Fundamentals Hub exposes standardized statement fields and field-source metadata through its REST API, which helps trace the inputs used in these calculations.)
Financial ratio analysis also requires a consistent capex sign convention. With expenditure represented as a positive amount, subtract it from CFO. If your source stores outflows as negative amounts, normalize the sign first; subtracting a negative expenditure would incorrectly add investment spending back to cash generation.
For example, assume a company reports $90 million of CFO for the first six months and $40 million for the first quarter, on the same reporting basis. Second-quarter CFO is $90 million - $40 million = $50 million. These are hypothetical amounts, matching the graphic below; they are not Microsoft figures.
Worked Calculations From a Company Filing
Use Microsoft's historical FY2025 figures, in USD millions. In its 2025 annual report income statements, the year ended June 30, 2025 column reports total revenue of 281,724, operating income of 128,528, and net income of 101,832. The balance sheets report total assets of 512,163 at June 30, 2024, and 619,003 at June 30, 2025.
| Calculation | Substitution | Result |
|---|---|---|
| Operating margin | 128,528 / 281,724 | 45.62% |
| Average assets | (512,163 + 619,003) / 2 | 565,583 |
| ROA | 101,832 / 565,583 | 18.00% |
| Asset turnover | 281,724 / 565,583 | 0.498x |
| Closing-assets ROA approximation | 101,832 / 619,003 | 16.45% |
The difference is (101,832 / 565,583 - 101,832 / 619,003) × 100 = 1.55 percentage points, rounded. These are author calculations using unrounded inputs; percentages are rounded to two decimals and turnover to three. The average-assets result is 565,583 million dollars. Both ROA figures use the same earnings, so their difference comes entirely from the denominator.
Keep the formula and input dates in the exported dataset. A column named only “ROA” loses the information needed to explain this difference; a documented average-assets convention preserves it.
When a Ratio Should Be Marked Unavailable
An empty cell and a reported zero are different facts. Missing inventory does not prove a business holds none, and missing borrowing does not prove it is debt-free. Keep missing inputs as null values, with a reason such as “opening assets unavailable,” instead of substituting zero.
Use metric-specific validity rules in financial ratio analysis. Zero denominators are undefined. Negative equity can make ROE or debt-to-equity misleading; negative net income can make CFO conversion difficult to interpret. Flag those cases as not meaningful for ordinary peer ranking, while retaining the underlying figures. A negative operating margin with positive revenue, however, is a valid description of an operating loss.
Near-zero denominators deserve a separate flag because tiny changes can produce enormous ratios. Preserve full precision during arithmetic and round only for presentation. Also record currency, units, reporting dates, filing reference, and formula version. A dollar-versus-million mismatch can escape detection when the resulting number merely looks unusual.
For historical research, distinguish the latest restated figures from information available on the original observation date. A backtest that uses a later filing's revisions can introduce hindsight. A reproducible calculation needs a declared filing-selection policy as well as a correct equation.
FAQ
These are common calculation questions in financial ratio analysis. Record the answers alongside your formulas so the next person using the spreadsheet knows which definitions apply.
Can closing assets replace average assets in ROA?
They can support a labeled approximation when opening assets are unavailable. Do not mix that approximation with average-assets ROA in a ranking without identifying the difference.
Does current assets minus inventory always give quick assets?
No. Prepayments and other less-liquid balances can remain. This reference uses cash, short-term marketable investments, and receivables, with their classifications checked against the filing.
Should total liabilities be used for debt to equity?
Not under the interest-bearing-debt convention used here. Calculate and label liabilities-to-equity separately; document lease treatment and avoid counting current maturities twice.
Can six-month CFO be divided by quarterly earnings?
Not for a same-period conversion ratio. Use six-month earnings or derive quarter-only CFO from comparable cumulative disclosures before dividing by quarterly net income.
Can a later filing change historical ROA?
A restatement can revise earnings or the asset balances used in the calculation. Keep the filing reference and distinguish a latest-restated series from a series restricted to information available at each historical observation date.