 Fundamentals Hub
You open a company's annual report and meet a table of contents longer than your research notes. Revenue, leases, share repurchases, and accounting policies compete for attention. The immediate task is deciding which questions to answer first.
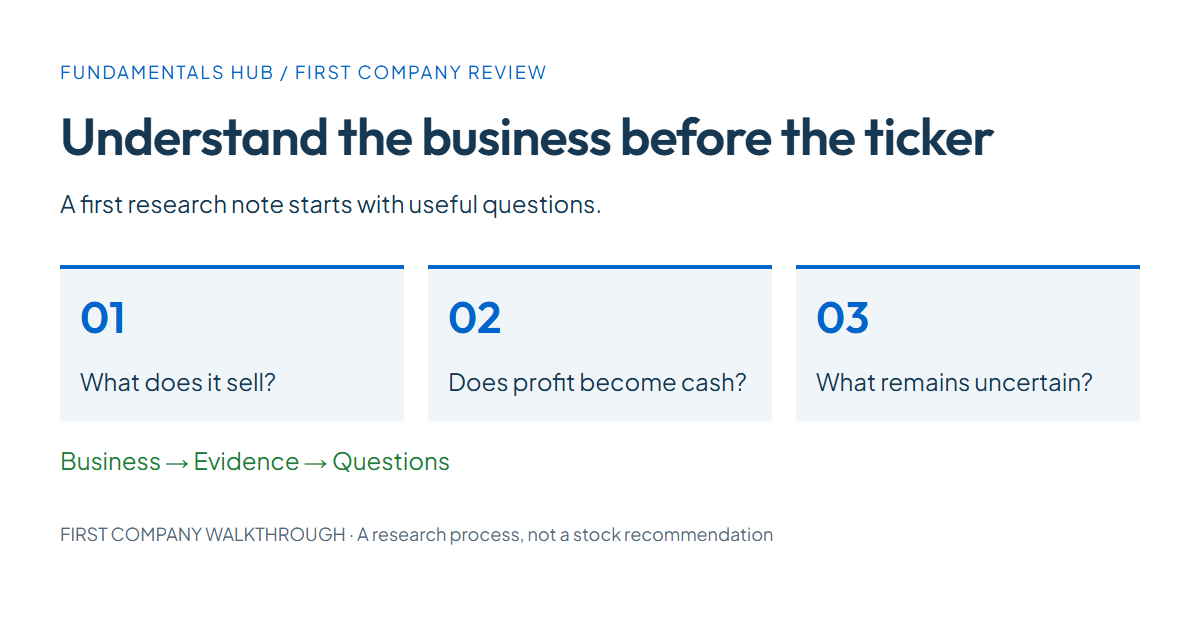
Fundamental analysis for beginners starts with one business and a small set of checks: what it sells, whether sales produce profit and cash, what obligations it carries, and what remains uncertain. A spreadsheet becomes useful after those questions have a purpose.
This walkthrough helps you finish a first company research note. It uses Microsoft's fiscal 2025 report as a historical practice case, not the latest available report or a stock recommendation. It concentrates on ordinary nonfinancial businesses; banks and insurers require different tools. Detailed ratio definitions belong in the financial ratio reference, while the broader fundamental analysis guide develops the full process.
1. Fundamental Analysis for Beginners Starts With the Business
- Fundamental analysis
- Research into a company’s business, financial performance, obligations and valuation assumptions.
- operating margin
- Operating income divided by revenue for the same reporting interval, displayed as a percentage.
- free cash flow
- In this article, operating cash flow minus cash additions to property and equipment.
- price-to-earnings ratio
- A dated share price divided by a specified earnings-per-share measure.
Begin with a business you can explain without quoting its marketing. Identify the customers, products, and sources of revenue, then name one factor that could change demand or costs; this gives your first financial checks a clear reason to exist.
Start with three sentences: who pays, what they receive, and why they might return. A software subscription, a supermarket purchase, and a construction contract create different revenue patterns. Familiarity with a product helps you ask questions, but it does not establish the economics of the company selling it.
Next, list one uncertainty worth investigating. Perhaps customers can cancel easily, the company depends on a few buyers, or new capacity requires substantial spending before it earns revenue. Treat these as questions to test in the filing. Avoid presenting guesses as disclosed facts.
Read the business description and segment discussion before calculating ratios. A group with several divisions can post rising total sales while one division weakens. Your first research note should explain what the aggregate number includes, even if a full segment model comes later.
2. Find the Filing and Record the Dates
Record the fiscal year-end, filing date, currency, and units before copying any figures. Begin with the annual filing, then check later disclosures before assessing current conditions; a correct historical number can describe a period that your question no longer concerns.
For a U.S. domestic issuer, find its Form 10-K through EDGAR or its investor relations website. The SEC's detailed 10-K reading guide points readers to Business in Item 1, Risk Factors in Item 1A, management's discussion in Item 7, and financial statements in Item 8. Read the audit report alongside the statements; an audit opinion does not guarantee an attractive investment.
Save the company name, fiscal year-end, filing date, currency, and display scale. “In millions” means 281,724 represents $281.724 billion when the currency is dollars. A fiscal year ending in June is not the same interval as a calendar year ending in December.
Use comparative columns from the same report when possible. If earlier figures were revised or presentation changed, document the change before comparing them. Then check later quarterly reports and material updates. The historical exercise below deliberately stops at FY2025; a current assessment requires newer disclosures.
For a line-by-line introduction to the reports, use how to read financial statements. Here, the aim is to gather enough evidence to answer a few business questions without copying the entire filing.
3. Build a Small Earnings Worksheet
Begin the worksheet with sales growth and operating margin, calculated from matching annual periods. Use those results to ask what changed in the business; another ratio is useful only when it resolves a question that the first calculations leave unanswered.
Microsoft's FY2025 income statements and cash flow statements supply the following historical inputs. Amounts are USD millions, for fiscal years ended June 30. Cash capex means additions to property and equipment; it is shown here as a positive outflow, while the report displays it in parentheses.
| Input | FY2024 | FY2025 |
|---|---|---|
| Revenue | 245,122 | 281,724 |
| Operating income | 109,433 | 128,528 |
| Net income | 88,136 | 101,832 |
| Cash from operations | 118,548 | 136,162 |
| Cash capex | 44,477 | 64,551 |
Keep net income in the worksheet as a check against operating cash flow: differences can reflect noncash charges and changes in operating assets or liabilities. Read the cash flow reconciliation before interpreting that gap.
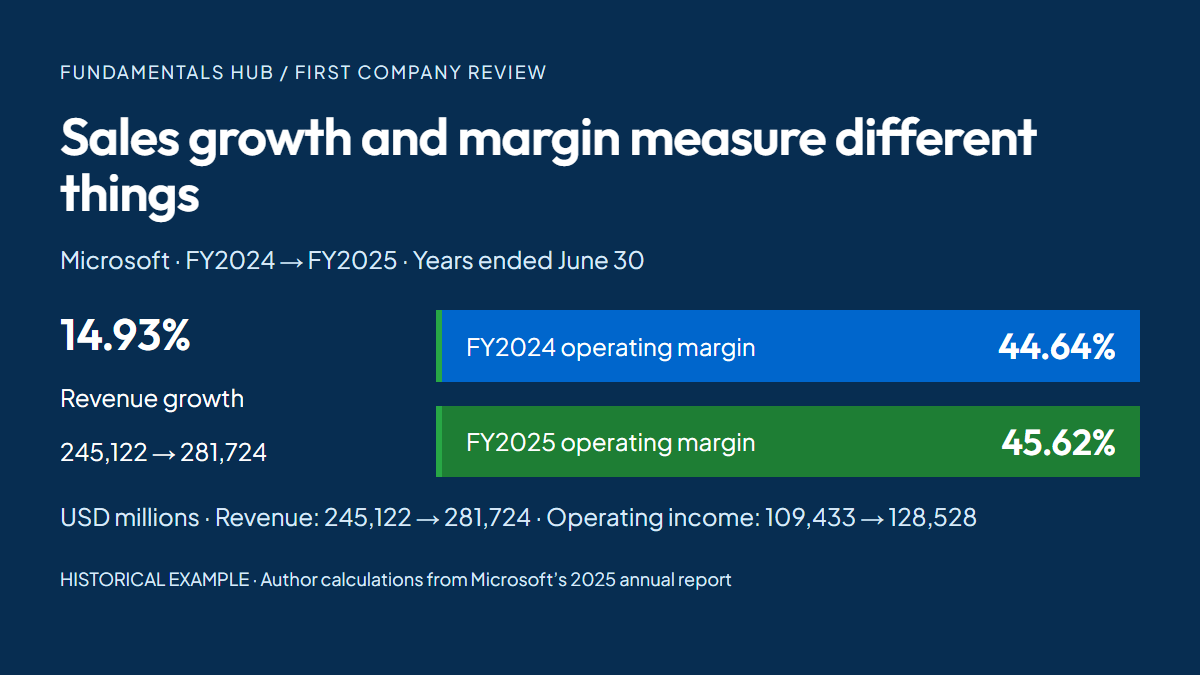
Revenue growth is (281,724 / 245,122 - 1) × 100 = 14.93%. FY2025 operating margin is 128,528 / 281,724 × 100 = 45.62%, compared with 109,433 / 245,122 × 100 = 44.64% in FY2024. The margin increased about 0.98 percentage points, which is different from a 0.98% relative increase.
Growth answers whether sales expanded. Operating margin measures the share of sales remaining after operating costs, before financing and income taxes. Neither calculation explains the cause. Return to management's discussion and test possible explanations such as pricing, sales mix, acquisitions, or expense changes.
Use a second column headed “Question to investigate.” Beside growth, ask whether it came from existing operations or an acquisition. Beside margin, ask whether a cost reduction can recur. That habit keeps arithmetic connected to research instead of turning a positive percentage into an automatic favorable judgment.
4. Check Cash and Financial Obligations
Follow operating cash into cash investment, then inspect the timing of financial obligations. Profit, available cash, borrowing maturities, and lease commitments answer different questions; read the statements and notes together before deciding how comfortably a business can meet its payments.
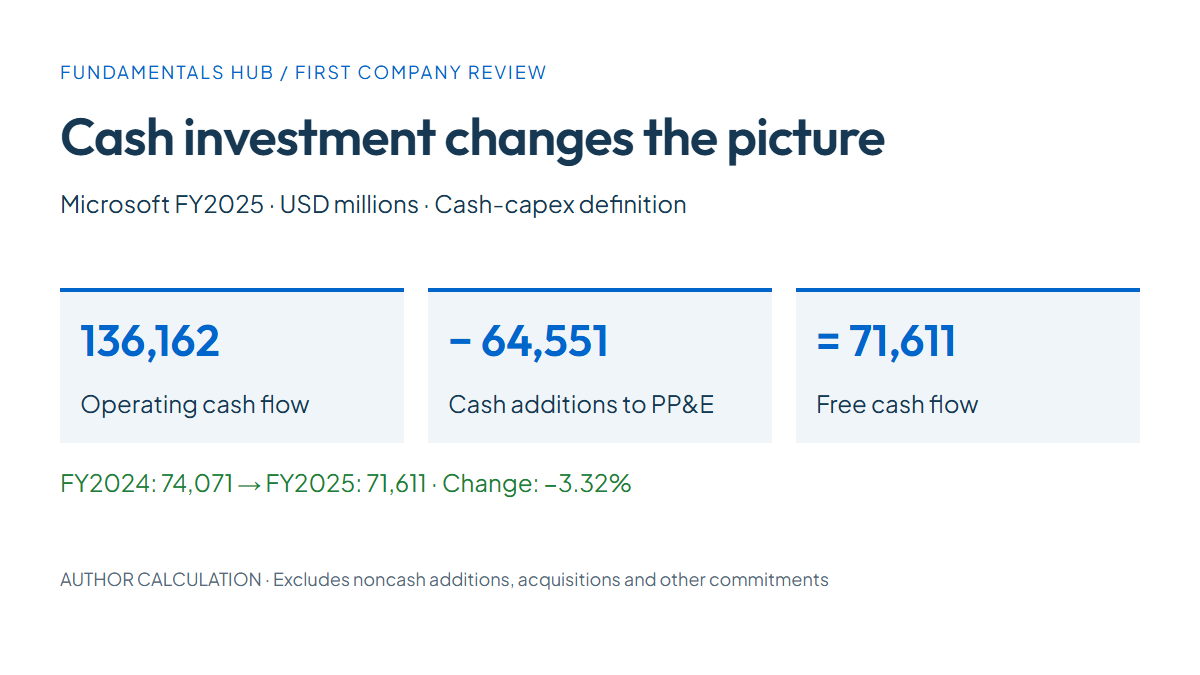
For this worksheet, define free cash flow as operating cash flow (CFO) minus cash additions to property and equipment. The author calculations are 136,162 - 64,551 = 71,611 for FY2025 and 118,548 - 44,477 = 74,071 for FY2024, in USD millions. On that definition, free cash flow fell 3.32% while revenue rose 14.93%.
That result prompts a question about investment needs; it does not establish that the spending was good or bad. This cash measure excludes noncash asset additions and does not deduct acquisitions or every contractual commitment. Microsoft also reports finance leases in its notes. Read those disclosures before treating cash capex as the company's complete infrastructure investment. The free cash flow explainer covers the calculation's boundaries in more detail.
(Fundamentals Hub provides standardized income statement, balance sheet, and cash flow fields for covered SEC filings, which can reduce manual copying into this worksheet.)
Inspect the timing of obligations next. Borrowings due within a year, lease payments, and trade bills create different demands on liquidity. Cash restricted for a particular purpose cannot automatically pay an unrelated bill. A balance sheet is a dated snapshot; your note needs the maturity disclosures as well as the totals.
One extraction trap deserves attention even on a first pass: interim cash flow statements can report cumulative year-to-date amounts. A six-month cash flow cannot be compared directly with three-month profit. Check the date headings and, where appropriate, subtract comparable first-quarter cash flow from the six-month amount to isolate the second quarter.
5. Separate Business Performance From the Share Price
Business performance and the price paid for shares are separate parts of the analysis. Compare a dated price with a defined earnings or cash measure, and state the expectations behind your interpretation; a profitable business can command a high price.
Fundamental analysis for beginners becomes misleading when “profitable company” quietly turns into “cheap stock.” Valuation adds a separate question: what expectations are already reflected in the price? The current report alone cannot answer it, and a past growth rate is not a forecast.
Consider a hypothetical company with a $60 share price and $3 of annual diluted earnings per share. Its trailing price-to-earnings ratio is 60 / 3 = 20x. At $90 with the same earnings, it is 30x. These are invented teaching amounts, not Microsoft prices or an estimate of fair value.
The exercise shows why the price matters while the reported business stays unchanged. A multiple still needs context: earnings durability, financing risk, growth expectations, and the suitability of peers. If earnings are zero or negative, a conventional positive P/E comparison breaks down. Record that limitation rather than manufacturing a useful-looking ratio.
Do not begin with an elaborate valuation model whose assumptions you cannot explain. First distinguish observations from expectations. “Revenue increased” is an observation; “revenue will keep increasing at that pace” is an assumption that needs its own argument.
6. Finish With a One-Page Research Note
Finish with a brief account of what the business does, what the evidence shows, and what remains uncertain. Separating observations from assumptions makes the note easier to revisit when later disclosures change a figure or challenge the explanation you recorded.
A first note can use four headings: business, evidence, risks, and unanswered questions. Include the source link and period beside the evidence. Use your own explanation beneath each amount. If you cannot say why a figure belongs in the note, leave it out until you can.
A compact practice note could read as follows. The business description comes from Microsoft's annual report; the observations use the worksheet calculations above.
Business: Microsoft supplies software and cloud services alongside other products. This first pass covers the consolidated group; differences between divisions need a separate segment review.
Evidence: FY2025 revenue rose 14.93%, operating margin reached 45.62%, and CFO-minus-cash-capex free cash flow declined 3.32%. These are historical observations, not forecasts.
Risk to investigate: Cash capex does not capture all investment commitments. Lease obligations and other future payments could change the interpretation of cash available for shareholder distributions.
Unanswered questions: What explains the higher spending, how long might it continue, and what changed in later filings? This note does not establish a fair share price or support a buy or sell decision.
Before closing the document, check whether any required input is missing, whether periods match, and whether a revision changes your comparison. Missing data is an unresolved item, not zero. The SEC's financial statement guide also stresses reading the reports together and considering industry context when interpreting ratios.
Repeat the workflow on another understandable business after you can explain the first note. Fundamental analysis for beginners advances through better questions and reproducible evidence. Adding a longer list of metrics helps only when it resolves a specific uncertainty.
FAQ: Your First Company Research Session
The following answers address choices during a first company review, including where to begin reading, how to limit the worksheet, how to handle missing inputs or forecasts, and what must be updated before a historical exercise becomes a current assessment.
Should I read the entire 10-K before starting my first note?
Start with the business description, management's discussion, financial statements, relevant notes, risk factors, and audit report. Use them to build an initial note and identify further reading. This first pass does not replace reading additional disclosures that matter to the question you are investigating.
How many metrics belong in a beginner's first worksheet?
Start with sales growth, operating margin, and a clearly defined cash flow measure, supported by the underlying amounts. Add a balance sheet or valuation measure when a specific question requires it. There is no fixed metric count that establishes whether a company is worth buying.
How should I separate facts and forecasts in my first note?
Put sourced historical amounts under evidence, and future expectations under assumptions or unanswered questions. Include the fiscal period beside each observation. A revenue growth calculation describes what happened; a prediction that the pace will continue needs a separate explanation and a way to check it later.
What should I write when an input is missing from my first worksheet?
Mark the input unavailable and record where you looked, rather than entering zero. Check the filing and relevant notes for the amount or its explanation. If it remains unresolved, identify the conclusion you cannot support and put that gap on your next research list.
Is a FY2025 practice note enough to assess a company today?
No. Review newer annual and quarterly filings, material updates, and a dated share price if you add valuation. Keep the historical worksheet for learning, but revise the evidence and assumptions before drawing a conclusion about present conditions.