 Fundamentals Hub
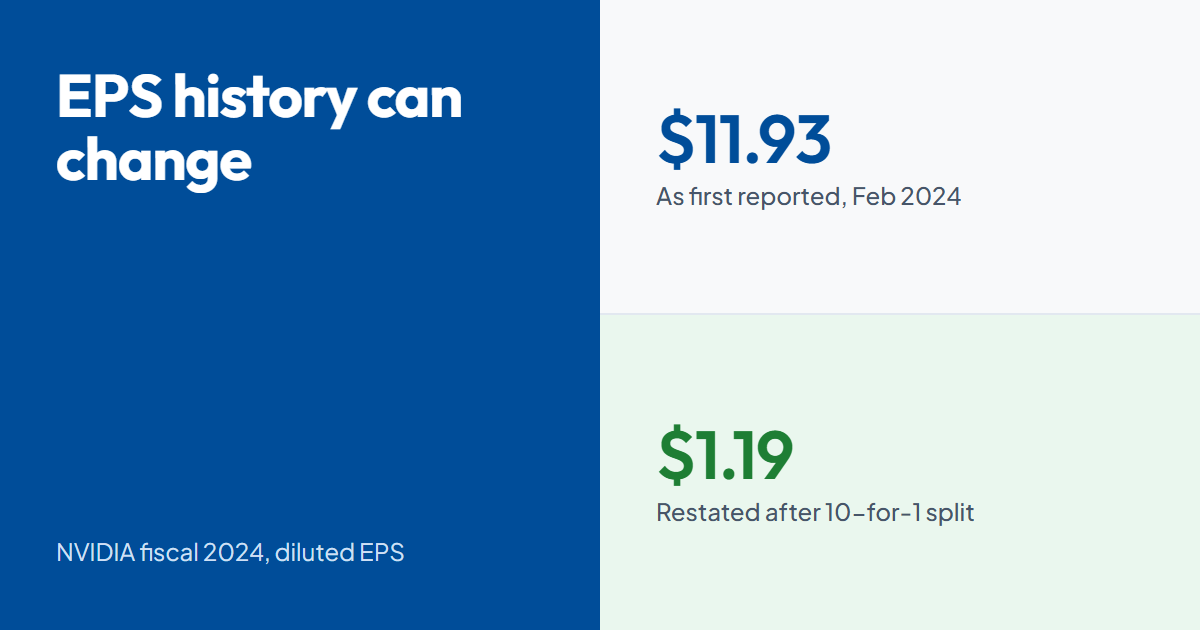
NVIDIA's diluted earnings per share for fiscal 2024 was $11.93. A year later, the same fiscal year appeared in NVIDIA's next annual report at $1.19. Neither filing was wrong: a ten-for-one stock split in June 2024 sat between the two 10-K reports, and the later one restated history on the new share basis.
That gap is the reason EPS data deserves more care than its single-number simplicity suggests. This explainer covers what earnings per share measures, how basic and diluted EPS differ, how to read EPS growth with a worked Apple example, and three traps that show up when you pull EPS from SEC filings: year-to-date quarters, a missing fourth quarter, and stock splits.
It is not a valuation guide or a stock recommendation. Price multiples built on EPS get a short mention; the financial ratio reference covers the wider ratio set.
What Earnings Per Share Measures
- Basic EPS
- Net income available to common shareholders divided by the weighted average number of common shares outstanding.
- Diluted EPS
- Earnings per share including the additional shares that options, restricted stock units, and convertible securities would create.
- antidilutive
- Describes a security that would raise EPS if converted, so it is excluded from the diluted calculation.
Earnings per share divides the profit available to common shareholders by the weighted average number of common shares outstanding during the period. It turns a company-sized number into a per-share one, which is what lets you compare profit across years even when the share count moves.
Two versions appear on the income statement:
- Basic EPS = (net income - preferred dividends) / weighted average common shares outstanding
- Diluted EPS = the same profit, adjusted where needed, divided by weighted average shares plus the additional shares that options, restricted stock units, and convertible securities would create
Diluted EPS answers a stricter question: what would each share have earned if every dilutive instrument had turned into stock? Under US GAAP (ASC 260), securities that would raise EPS are excluded from the diluted count as antidilutive. As a result, diluted EPS is never higher than basic EPS for a profitable company. When a company reports a loss from continuing operations, potential shares would shrink the loss per share, so diluted and basic EPS come out identical.
Apple's fiscal 2025 10-K shows how small the gap can be for a mature company. Basic EPS was $7.49 and diluted EPS was $7.46, a difference of three cents across roughly 15 billion diluted shares. For a younger company paying heavily in stock compensation, the spread can be much wider, and that spread itself tells you something about future dilution.
"Weighted average" matters more than it looks. A company that buys back 5% of its shares in the final month of the year barely changes its weighted count for that year. The full effect arrives the following year. That timing lag explains why EPS can keep rising after a buyback program has slowed.
Reading EPS Growth: Apple, Fiscal 2024 to 2025
EPS growth equals the change in profit plus the effect of a changing share count. Splitting those two parts apart is the most useful thing you can do with EPS data, because it shows whether a company earned more or simply divided its earnings among fewer shares.
Here are Apple's reported figures from its fiscal 2025 10-K. Net income is in millions of US dollars, and the share count is in millions of weighted average diluted shares.
| Fiscal year | Net income ($M) | Diluted shares (M) | Diluted EPS |
|---|---|---|---|
| FY2024 (ended Sept 28, 2024) | 93,736 | 15,408.1 | $6.08 |
| FY2025 (ended Sept 27, 2025) | 112,010 | 15,004.7 | $7.46 |
| Change | +19.5% | -2.6% | +22.7% |
Net income grew 19.5%. Diluted EPS grew 22.7%. The extra three points came from a 2.6% smaller diluted share count, the result of Apple's repurchases. You can verify the reported EPS directly: 112,010 / 15,004.7 = 7.4650 before rounding, or 7.46 to the cent, matching Apple's reported $7.46.
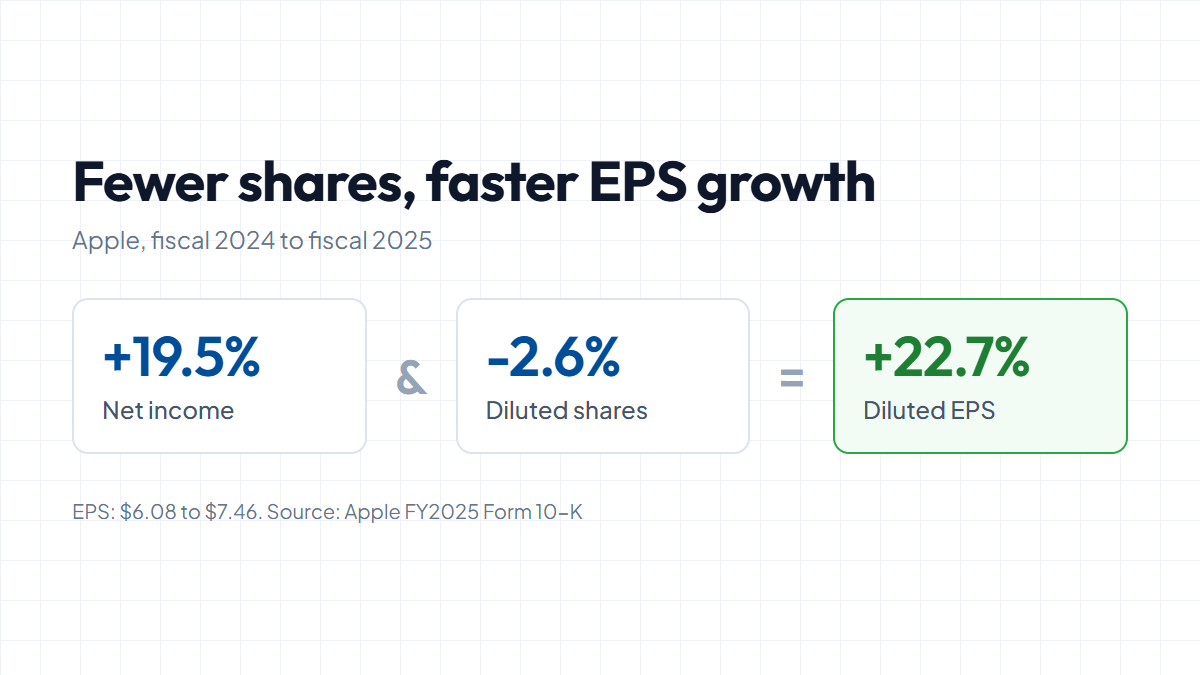
The comparison base needs checking too. Apple's fiscal 2024 results include a one-time income tax charge of $10.2 billion, net, tied to the European Commission's State Aid decision, which Apple disclosed in its fiscal 2024 10-K. Spread over 15.4 billion diluted shares, that charge reduced fiscal 2024 EPS by roughly $0.66. Adding it back produces an adjusted FY2024 figure near $6.75, and growth of about 10.6% instead of 22.7%. Those adjusted figures are an author calculation for illustration, not a number Apple reported.
Neither growth rate is "the right one." The reported 22.7% is what happened under GAAP. The adjusted figure isolates how much of that growth came from lapping an unusual charge. Write down both, and state which one you use. The habit of separating recurring results from one-off items is covered in depth in the financial statement analysis guide.
Quarterly EPS Data Does Not Add Up Neatly
Annual EPS is not the sum of four quarterly EPS figures, and a 10-Q does not always report a standalone quarter. Both facts break the simple spreadsheet approaches people reach for first, especially when building trailing twelve month (TTM) numbers.
Apple's fiscal 2025 filings illustrate it. Each 10-Q reported both the three-month quarter and the year-to-date period:
| Period | Reported in | Diluted EPS |
|---|---|---|
| Q1 (three months) | Q1 10-Q | $2.40 |
| Six months, year to date | Q2 10-Q | $4.05 |
| Q2 (three months) | Q2 10-Q | $1.65 |
| Nine months, year to date | Q3 10-Q | $5.62 |
| Q3 (three months) | Q3 10-Q | $1.57 |
| Full year | 10-K | $7.46 |
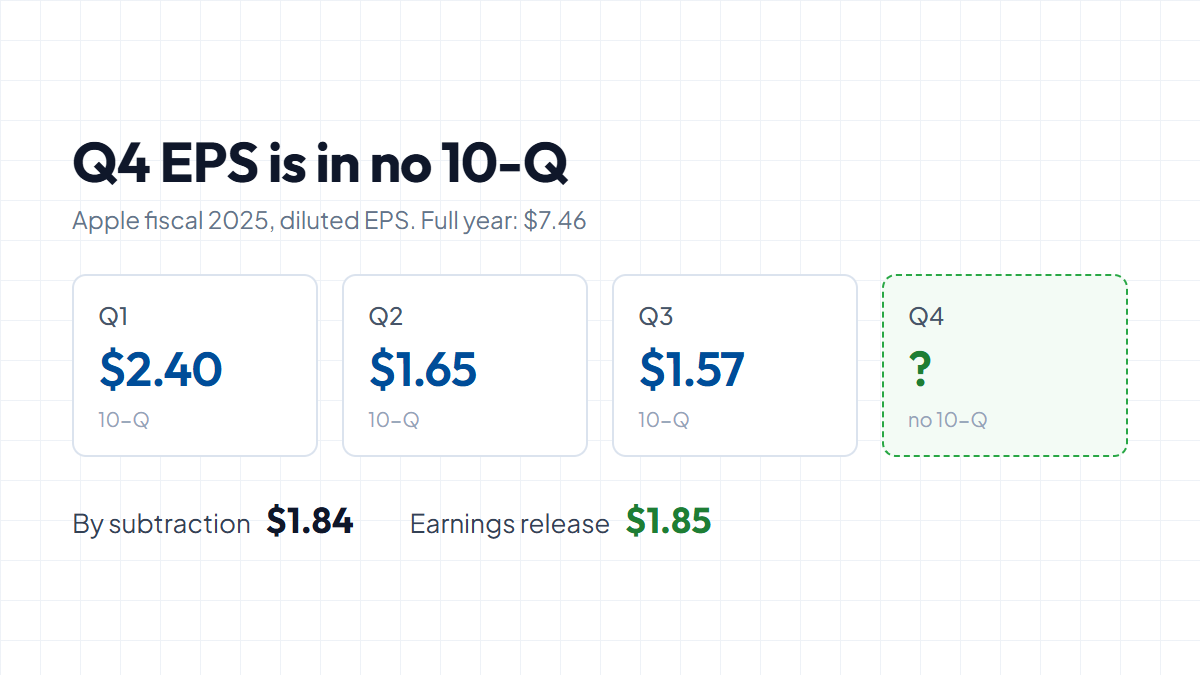
There is no 10-Q for the fourth quarter. The 10-K reports the full year, so Q4 has to come from somewhere else. Subtraction: $7.46 - $5.62 = $1.84. Apple's fourth-quarter earnings release reported $1.85.
The one-cent difference is not rounding noise. Each period's EPS uses that period's own weighted share count, and Apple's share count fell every quarter. Profit per share from different denominators cannot be added or subtracted exactly. Subtraction will usually land close, but "close" is a derived estimate, not a reported figure, and it can drift further for a company issuing or retiring shares quickly.
The same rule applies to year-to-date figures. If a company reports only six-month EPS in its Q2 10-Q, the second quarter cannot be recovered by subtracting Q1 EPS. Net income subtracts cleanly; per-share amounts do not.
For TTM EPS, the standard shortcut is to add the four most recent reported quarterly EPS figures. Using Apple's quarters through June 2026, that is $1.85 + $2.84 + $2.01 + $2.02 = $8.72. A stricter alternative divides TTM net income by an average diluted share count. When the share count moves a lot, record which method produced the number.
Stock Splits Rewrite EPS History
A stock split changes every historical per-share figure, but SEC XBRL data only contains the restated value if a later filing re-presented that period. Some historical quarters never get restated, which leaves pre-split and post-split values mixed in the same EPS series.
Return to NVIDIA. Its ten-for-one split took effect in June 2024. The fiscal 2024 annual figure was restated in the next 10-K, which is why both $11.93 and $1.19 exist in the XBRL record for the same fiscal year. The later filing carries the post-split figure.
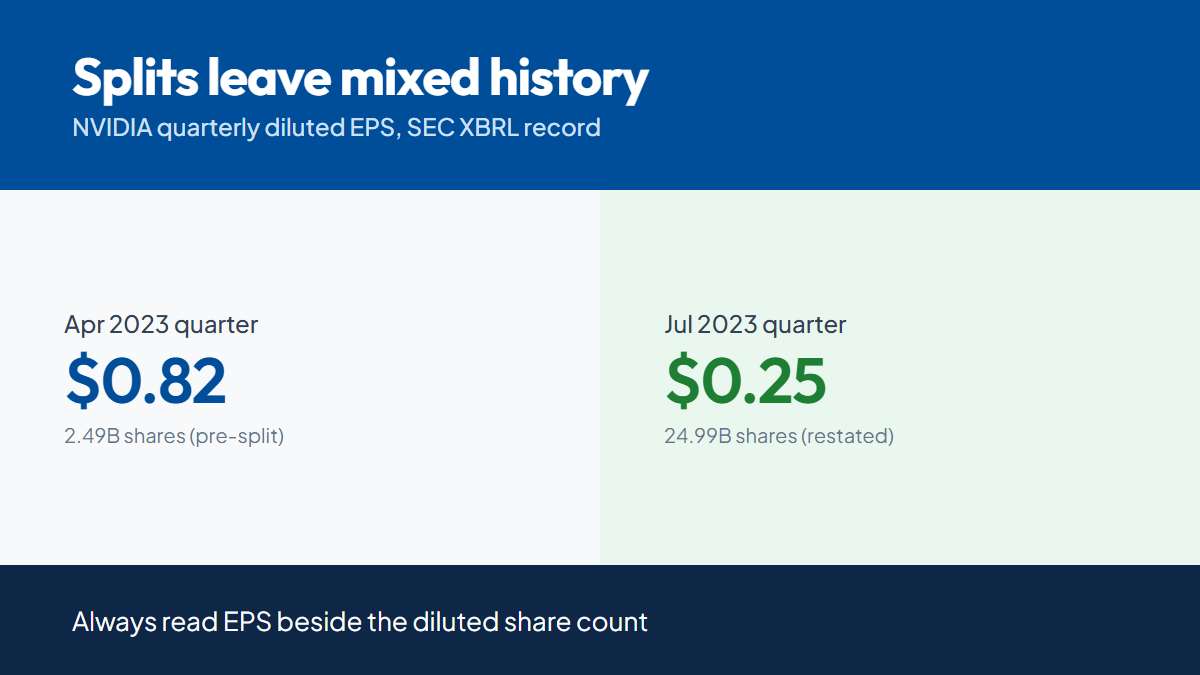
The quarter ended April 30, 2023 had a different fate. NVIDIA reported diluted EPS of $0.82 for it, and repeated $0.82 as the comparative column in its May 2024 10-Q, filed days before the split took effect. No later filing presented that quarter again. The SEC's company facts data therefore holds only the pre-split $0.82, while the split-adjusted figure would be about $0.08.
Three checks catch this in a time series:
- Look at the diluted share count beside EPS. In the stored series, NVIDIA's weighted diluted shares jump from about 2.5 billion to about 25 billion between adjacent quarters. A tenfold change in shares with no tenfold change in net income means the per-share basis changed.
- Prefer the latest filing for each period. When a fact appears in several filings, the most recent one reflects the current share basis if the period was re-presented.
- Recompute EPS from net income and shares. If net income / diluted shares disagrees with reported EPS by an order of magnitude, the two inputs come from different share bases.
This trap also affects any metric divided by shares, including book value per share, dividends per share, and shares outstanding. A chart of EPS that drops 90% overnight is almost always a split, not a collapse in profit.
Pulling EPS Data From SEC Filings and APIs
In SEC XBRL, diluted EPS is reported under the us-gaap tag EarningsPerShareDiluted, with basic EPS under EarningsPerShareBasic. In the company facts JSON, these values sit under the unit key USD/shares, not USD. A parser that only reads USD units will silently skip every per-share fact.
Each fact carries a start and end date, the form and filed date, and the accession number. For EPS work, the start date matters most: Apple's Q2 10-Q contains two diluted EPS facts ending March 29, 2025, one starting September 29, 2024 (year to date) and one starting December 29, 2024 (the quarter). Filter by duration before treating a value as quarterly. The XBRL data guide covers contexts and duplicate facts in more detail.
(Fundamentals Hub returns diluted_eps and diluted_shares in the same row for annual and quarterly periods, so the per-share figure and its denominator arrive together.)
Here is a short Python example that pulls five years of annual EPS data for one ticker and separates profit growth from share-count change:
import os
import requests

BASE_URL = "https://fundamentalshub.com/api/v2"
API_KEY = os.environ["FUNDAMENTALS_HUB_API_KEY"]

resp = requests.get(
    f"{BASE_URL}/companies/AAPL/financials",
    params={"fields": "income", "period": "annual", "limit": 5},
    headers={"X-API-Key": API_KEY},
    timeout=30,
)
resp.raise_for_status()
years = sorted(resp.json()["data"], key=lambda p: p["period_end"])

for prev, cur in zip(years, years[1:]):
    eps_growth = cur["diluted_eps"] / prev["diluted_eps"] - 1
    ni_growth = cur["net_income"] / prev["net_income"] - 1
    share_change = cur["diluted_shares"] / prev["diluted_shares"] - 1
    print(f'{cur["filing_period"]}: EPS {cur["diluted_eps"]:.2f} '
          f'({eps_growth:+.1%}), net income {ni_growth:+.1%}, '
          f'diluted shares {share_change:+.1%}')
Before trusting the output for another company, add a guard: if share_change exceeds +100% or falls below -50% in a single year, flag the row for a split check instead of printing a growth rate. The guard also catches spin-offs and large acquisitions paid in stock, which deserve a manual look anyway.
Fundamentals Hub leaves a quarterly EPS value empty when the filing did not report that quarter on its own, rather than deriving a per-share number by subtraction. For many companies that includes the fourth quarter, so TTM EPS is filled at fiscal year-end, where it equals annual EPS, and can be empty mid-year. A missing value signals "not reported for this period," which is safer than an estimate presented as a fact. If you need TTM EPS in those periods, compute it yourself and label it as derived.
FAQ: Working With EPS Data
Can diluted EPS ever be higher than basic EPS?
Not for a profitable company under US GAAP. Any security that would raise EPS is excluded from the diluted calculation as antidilutive. With a loss from continuing operations, diluted EPS equals basic EPS, because adding shares would make the loss per share look smaller.
Why don't four quarterly EPS figures add up to annual EPS?
Each period divides profit by its own weighted average share count. When the count changes during the year, through buybacks or issuance, the four quarterly figures sum to a slightly different number than the annual figure. Apple's fiscal 2025 quarters sum to $7.47 against a reported annual $7.46.
Is it safe to calculate Q4 EPS as annual EPS minus nine-month EPS?
It gives an estimate, not the reported figure. Apple's fiscal 2025 subtraction yields $1.84 while its earnings release reported $1.85. Label any subtracted per-share value as derived, and check the company's earnings release (filed with an 8-K) when you need the reported number.
How can I tell whether an old EPS figure is split-adjusted?
Compare the diluted share count stored with it against later periods. If shares jump by the split ratio at one boundary and EPS falls by the same ratio, the older figures are on the pre-split basis. Then check whether a later filing restated that period.
Should I use EPS from continuing operations instead of total EPS?
If a company sold or discontinued a business, EPS from continuing operations gives a cleaner trend for the business that remains. Many companies report both. Keep the choice consistent across every year in your series, because mixing the two creates artificial jumps.