 Fundamentals Hub

Your Python script already pulls prices. The dashboard breaks when someone asks for revenue, free cash flow, total debt, or TTM net income. Price APIs are easy to find. A stock API Python workflow that gives clean fundamentals is a different problem, since the source data comes from SEC filings, XBRL tags, fiscal periods, and company-specific reporting choices.
This guide is about building a small fundamentals dashboard, not a trading terminal. It will use a REST API, requests, pandas, and a few defensive parsing habits. If you want the lower-level SEC path, start with the financial data Python guide or the SEC data JSON walkthrough. Here, the goal is simpler: ticker in, normalized financial data out, then a dashboard your users can scan.
Why Stock API Python Workflows Need More Than Prices
- Stock API Python
- A Python workflow for fetching stock-related company data, including normalized fundamentals.
- TTM fundamentals
- Trailing twelve-month income and cash flow metrics plus latest balance sheet values.
- CIK
- The SEC's Central Index Key, useful for stable company identification when tickers change.
- XBRL tags
- Labels inside SEC filings that identify reported financial facts such as revenue or net income.
A useful stock API in Python returns more than last price, volume, and market cap. Fundamental dashboards need income statement, balance sheet, and cash flow fields in one consistent shape.
That consistency matters in dashboards that compare companies. If Apple's field is revenue, Microsoft's is totalRevenue, and another company reports a null after using a different XBRL tag, the chart looks clean but the data pipeline is brittle. SEC EDGAR is the source of truth for US public company filings, but it is not built as a dashboard-ready API.
Fundamentals Hub sits between raw SEC filings and your Python app. The API normalizes the common fields into names such as revenue, gross_profit, operating_income, net_income, total_assets, total_debt, cfo, capex, and free_cash_flow. It also supports TTM, annual, and quarterly periods, which keeps the dashboard logic focused on presentation rather than XBRL period selection.
Step 1: Set Up the Python Client
The public API uses /api/v2 and expects an API key in the X-API-Key header. Keep the key in an environment variable, not in the notebook or repository.
Install the basic dependencies:
pip install requests pandas streamlitCreate a tiny client wrapper:
import os
            import requests

            BASE_URL = "https://fundamentalshub.com/api/v2"
            API_KEY = os.environ["FUNDAMENTALS_HUB_API_KEY"]

            session = requests.Session()
            session.headers.update({"X-API-Key": API_KEY})


            def api_get(path: str, params: dict | None = None) -> dict:
                response = session.get(
                    f"{BASE_URL}{path}",
                    params=params,
                    timeout=20,
                )

                if response.status_code == 429:
                    reset = response.headers.get("X-RateLimit-Reset")
                    raise RuntimeError(f"Rate limit exceeded. Reset hint: {reset}")

                response.raise_for_status()
                payload = response.json()

                if not payload.get("success"):
                    raise RuntimeError(payload.get("error", "API request failed"))

                return payload
The wrapper is intentionally boring. A dashboard needs predictable failures more than clever retries. Surface HTTP errors, treat success: false as a failed request, and expose rate-limit headers when they matter.
Step 2: Search for a Company
Users type tickers, company names, and partial names. The search endpoint handles that first step:
results = api_get(
                "/companies/search",
                params={"q": "apple", "limit": 5},
            )

            for company in results["data"]:
                print(company["ticker"], company["name"], company["cik"])
The response shape is designed for a search box:
{
              "success": true,
              "data": [
                {
                  "cik": "0000320193",
                  "name": "Apple Inc.",
                  "ticker": "AAPL",
                  "sic_code": "3571",
                  "industry": "ELECTRONIC COMPUTERS"
                }
              ],
              "pagination": {
                "limit": 5,
                "offset": 0,
                "total": 1,
                "has_more": false
              }
            }
Use the ticker for the next call if the user picked a public company with a primary ticker. Keep the CIK too. CIKs are stable SEC identifiers, and they save debugging time when tickers change, share classes exist, or a company has multiple listed securities.
Step 3: Pull TTM Fundamentals
The financials endpoint accepts either a ticker or CIK. For a dashboard landing view, TTM is a good default as it reflects the latest trailing twelve-month operating performance rather than the last fiscal year alone.
payload = api_get(
                "/companies/AAPL/financials",
                params={"period": "ttm", "fields": "all"},
            )

            company = payload["company"]
            latest = payload["data"][0]

            print(company["name"])
            print(latest["period_end"])
            print(latest["revenue"])
            print(latest["free_cash_flow"])
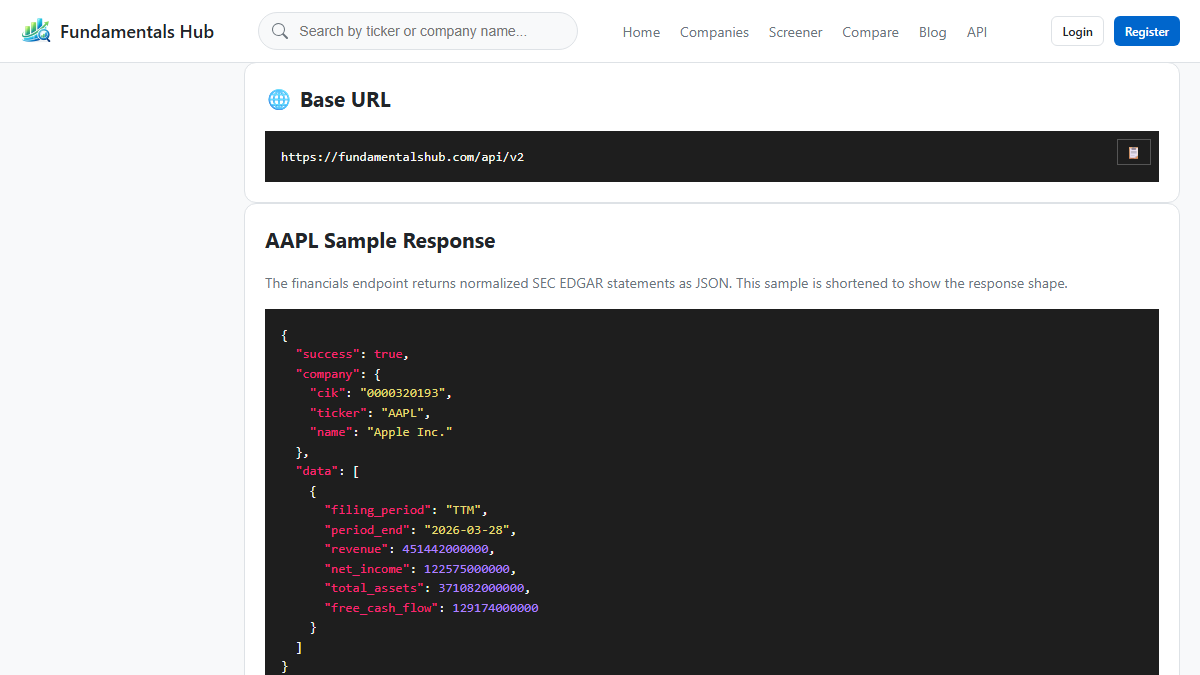
The API returns a flat financial record, which is easier to work with in pandas than deeply nested statement objects:
{
              "success": true,
              "company": {
                "cik": "0000320193",
                "ticker": "AAPL",
                "name": "Apple Inc."
              },
              "data": [
                {
                  "filing_period": "TTM",
                  "period_end": "2026-03-28",
                  "revenue": 451442000000,
                  "gross_profit": 216071000000,
                  "operating_income": 147366000000,
                  "net_income": 122575000000,
                  "total_assets": 371082000000,
                  "total_debt": 82714000000,
                  "cfo": 140222000000,
                  "capex": 11048000000,
                  "free_cash_flow": 129174000000
                }
              ],
              "periods_returned": 1
            }
The key point is not the individual Apple numbers. The useful part is that the same field names apply across companies, so your dashboard code does not need one parser per filer. (Fundamentals Hub normalizes the SEC filing data first, so the Python layer works with clean JSON instead of raw XBRL tags.)
Step 4: Shape the JSON into a DataFrame
Dashboards become easier once each company is one row and each metric is one column. This helper fetches TTM fundamentals for a list of tickers and keeps only the fields needed for a compact comparison table:
import pandas as pd

            METRICS = [
                "revenue",
                "gross_profit",
                "operating_income",
                "net_income",
                "total_assets",
                "total_debt",
                "cfo",
                "capex",
                "free_cash_flow",
            ]


            def fetch_ttm_row(ticker: str) -> dict:
                payload = api_get(
                    f"/companies/{ticker}/financials",
                    params={"period": "ttm", "fields": "all"},
                )

                if not payload["data"]:
                    return {
                        "ticker": ticker,
                        "company": payload["company"]["name"],
                        "period_end": None,
                        **{metric: None for metric in METRICS},
                    }

                row = payload["data"][0]
                return {
                    "ticker": payload["company"]["ticker"],
                    "company": payload["company"]["name"],
                    "period_end": row["period_end"],
                    **{metric: row.get(metric) for metric in METRICS},
                }


            def fundamentals_frame(tickers: list[str]) -> pd.DataFrame:
                rows = [fetch_ttm_row(ticker) for ticker in tickers]
                return pd.DataFrame(rows)


            df = fundamentals_frame(["AAPL", "MSFT", "GOOGL"])
            print(df)
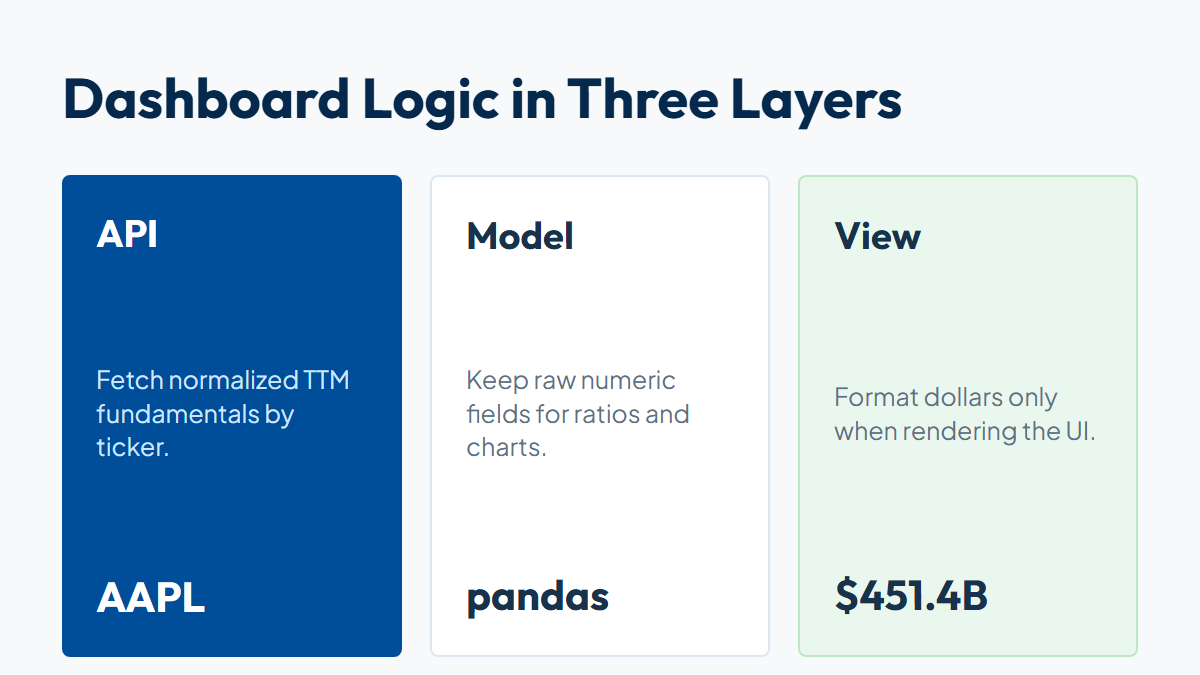
Do not divide by one million in the API client. Keep raw numbers in the DataFrame, then format them for display at the edge. That lets you calculate ratios without accidentally mixing scaled and unscaled values.
Add a display formatter:
def dollars_billions(value):
                if value is None or pd.isna(value):
                    return "n/a"
                return f"${value / 1_000_000_000:,.1f}B"


            display_columns = [
                "ticker",
                "company",
                "period_end",
                "revenue",
                "operating_income",
                "net_income",
                "free_cash_flow",
                "total_debt",
            ]

            formatted = df[display_columns].copy()
            for column in display_columns[3:]:
                formatted[column] = formatted[column].map(dollars_billions)
That separation is mundane, but it prevents a common dashboard bug: a chart uses raw revenue, a table uses revenue in billions, and a ratio divides one by the other.
Step 5: Build the Dashboard View
Streamlit is enough for a quick internal dashboard. The same data layer can later move into Dash, FastAPI, Django, or a scheduled reporting job.
import streamlit as st

            st.set_page_config(page_title="Fundamentals Dashboard", layout="wide")

            st.title("Company Fundamentals")

            tickers_input = st.text_input(
                "Tickers",
                value="AAPL, MSFT, GOOGL",
                help="Comma-separated US public company tickers",
            )

            tickers = [
                item.strip().upper()
                for item in tickers_input.split(",")
                if item.strip()
            ]

            if tickers:
                df = fundamentals_frame(tickers)

                st.subheader("TTM Snapshot")
                display = df[[
                    "ticker",
                    "company",
                    "period_end",
                    "revenue",
                    "operating_income",
                    "net_income",
                    "free_cash_flow",
                ]].copy()

                for column in ["revenue", "operating_income", "net_income", "free_cash_flow"]:
                    display[column] = display[column].map(dollars_billions)

                st.dataframe(display, use_container_width=True, hide_index=True)

                chart = df.set_index("ticker")[["revenue", "free_cash_flow"]]
                st.bar_chart(chart)
Run it locally:
streamlit run app.pyThe first version does not need authentication screens, watchlists, or persistence. It needs one reliable path from ticker input to financial metrics. Once that works, add saved tickers, cached responses, and custom metric sets.
Handling Missing Fields and API Errors
Financial statement data is not as regular as price data. A missing value does not always mean the API failed. It can mean the company did not report that field, used a reporting structure that does not map cleanly, or has no recent standardized data in the database yet.
Your dashboard needs to distinguish three states:
| State | Example | UI treatment |
|---|---|---|
| Request failed | 401, 429, network timeout | Show an error and retry guidance |
| Company not found | Invalid ticker | Ask the user to search again |
| Field missing | free_cash_flow: null | Show n/a, keep the row |
Use the rate-limit headers to avoid blind retry loops:
def api_get(path: str, params: dict | None = None) -> dict:
                response = session.get(f"{BASE_URL}{path}", params=params, timeout=20)

                remaining = response.headers.get("X-RateLimit-Remaining")
                if remaining == "0":
                    reset = response.headers.get("X-RateLimit-Reset", "later")
                    raise RuntimeError(f"API limit reached. Try again after {reset}.")

                if response.status_code == 401:
                    raise RuntimeError("Invalid API key")

                if response.status_code == 404:
                    raise RuntimeError("Company or endpoint not found")

                response.raise_for_status()
                payload = response.json()

                if not payload.get("success"):
                    raise RuntimeError(payload.get("error", "API request failed"))

                return payload
A practitioner detail worth building around: annual and quarterly filings do not always behave like neat database rows. For Q2 and Q3 flow facts, inspect each field's duration and subtract the preceding cumulative value only when the reported fact is year-to-date. There is no Q4 10-Q, so additive Q4 flows come from the annual 10-K minus Q1, Q2, and Q3. A normalized API can handle that upstream, but your dashboard still has to label period type clearly so users know whether they are looking at TTM, annual, or quarterly data.
When to Cache Data
A dashboard that fetches three companies on page load is fine. A dashboard that refreshes 300 tickers whenever someone changes a dropdown is wasteful.
Cache at the application layer when the same ticker and period are requested repeatedly:
from functools import lru_cache


            @lru_cache(maxsize=512)
            def fetch_ttm_row_cached(ticker: str) -> tuple:
                row = fetch_ttm_row(ticker)
                return tuple(row.items())


            def cached_frame(tickers: list[str]) -> pd.DataFrame:
                rows = [dict(fetch_ttm_row_cached(ticker)) for ticker in tickers]
                return pd.DataFrame(rows)
For Streamlit, use its cache decorator instead:
@st.cache_data(ttl=3600)
            def cached_fundamentals_frame(tickers: tuple[str, ...]) -> pd.DataFrame:
                return fundamentals_frame(list(tickers))
Hourly caching is enough for many fundamentals dashboards since financial statements update when filings arrive, not every second. The dashboard can still show live prices from another source if you need market data. Keep fundamentals and prices as separate pipelines so each one can refresh on its own schedule.
What to Build Next
After the first dashboard works, the next upgrades are small:
- Add a company search box before the dashboard table.
- Add annual history with
period=annual&limit=5. - Add field selectors for income, balance sheet, and cash flow views.
- Add ratio calculations such as operating margin, free cash flow margin, and debt to assets.
- Persist selected tickers in a database or user profile.
Keep the calculation layer explicit. For example, calculate operating margin as operating_income / revenue, and make the denominator visible in the code. Financial dashboards become hard to trust when ratios appear without a clear source field.
FAQ
What is the best stock API in Python for fundamentals?
The best fit depends on whether you need market prices, SEC filing data, or normalized financial statements. For fundamentals, prioritize consistent statement fields, period support, and clear API responses over the number of endpoints.
Can I use the same API for annual and TTM data?
Yes. The Fundamentals Hub financials endpoint supports period=ttm, period=annual, period=quarterly, and period=all. Use TTM for current operating snapshots and annual periods for long-term trend views.
Does a Python dashboard need CIKs or tickers?
Store both. Tickers are user-friendly, but CIKs are SEC identifiers and are more stable for debugging filing data. A good search flow includes both values.
Why not use raw SEC EDGAR directly in the dashboard?
You can, but raw SEC JSON still requires CIK lookup, XBRL tag mapping, unit filtering, period selection, and normalization. That work belongs in a data layer, not in the dashboard view.
Does this replace a market data API?
No. Fundamentals Hub focuses on standardized SEC financial statements. Use a market data source for real-time or delayed prices, then join it with fundamentals in your Python app.